- Your cart is empty
- Continue Shopping


BCS-040 Statistical Techniques Solved Assignment 2018-2019
₹30.00
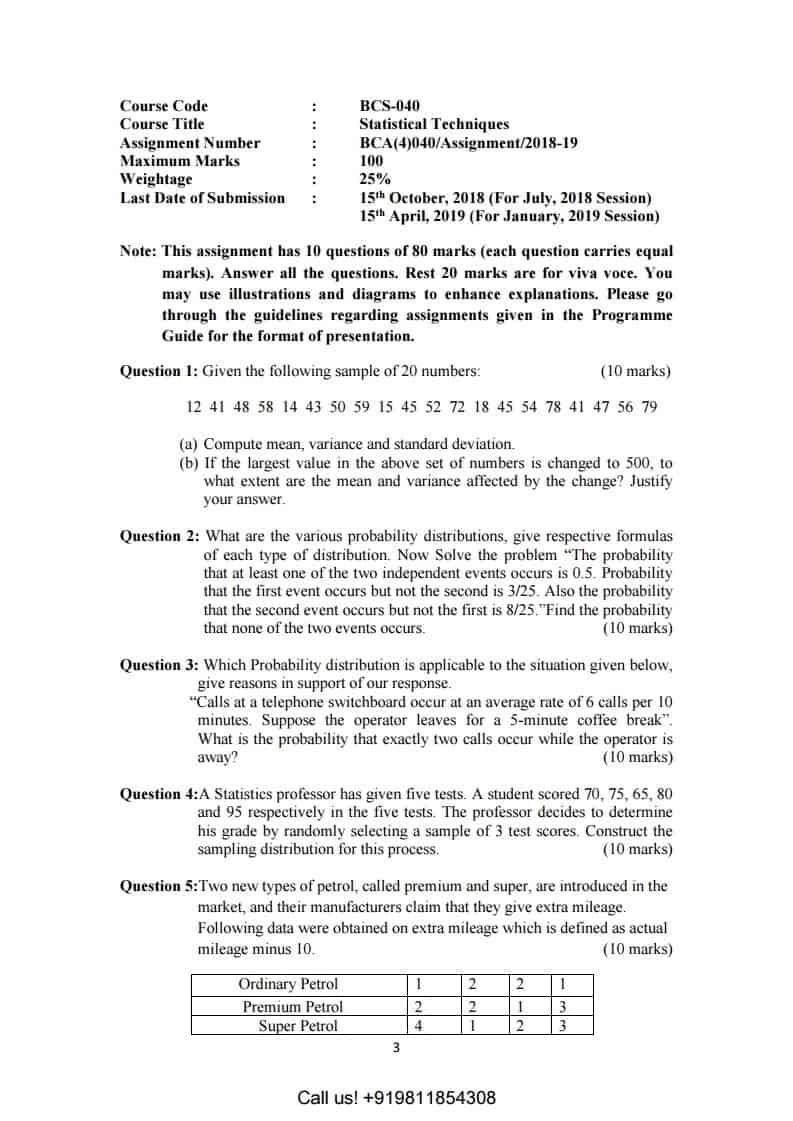
Course Code : BCS-040
Course Title : Statistical Techniques
Assignment Number : BCA(4)040/Assignment/2018-19
Maximum Marks : 100
Weightage : 25%
Last Date of Submission : 15th October, 2018 (For July, 2018 Session)
15th April, 2019 (For January, 2019 Session)
Out of stock
Course Code : BCS-040
Course Title : Statistical Techniques
Assignment Number : BCA(4)040/Assignment/2018-19
Maximum Marks : 100
Weightage : 25%
Last Date of Submission : 15th October, 2018 (For July, 2018 Session)
15th April, 2019 (For January, 2019 Session)
Note: This assignment has 10 questions of 80 marks (each question carries equal
marks). Answer all the questions. Rest 20 marks are for viva voce. You
may use illustrations and diagrams to enhance explanations. Please go
through the guidelines regarding assignments given in the Programme
Guide for the format of presentation.
Question 1: Given the following sample of 20 numbers: (10 marks)
12 41 48 58 14 43 50 59 15 45 52 72 18 45 54 78 41 47 56 79
(a) Compute mean, variance and standard deviation.
(b) If the largest value in the above set of numbers is changed to 500, to
what extent are the mean and variance affected by the change? Justify
your answer.
Question 2: What are the various probability distributions, give respective formulas
of each type of distribution. Now Solve the problem “The probability
that at least one of the two independent events occurs is 0.5. Probability
that the first event occurs but not the second is 3/25. Also the probability
that the second event occurs but not the first is 8/25.”Find the probability
that none of the two events occurs. (10 marks)
Question 3: Which Probability distribution is applicable to the situation given below,
give reasons in support of our response.
“Calls at a telephone switchboard occur at an average rate of 6 calls per 10
minutes. Suppose the operator leaves for a 5-minute coffee break”.
What is the probability that exactly two calls occur while the operator is
away? (10 marks)
Question 4:A Statistics professor has given five tests. A student scored 70, 75, 65, 80
and 95 respectively in the five tests. The professor decides to determine
his grade by randomly selecting a sample of 3 test scores. Construct the
sampling distribution for this process. (10 marks)
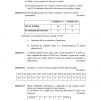
Question 5:Two new types of petrol, called premium and super, are introduced in the
market, and their manufacturers claim that they give extra mileage.
Following data were obtained on extra mileage which is defined as actual
mileage minus 10. (10 marks)
Ordinary Petrol 1 2 2 1
Premium Petrol 2 2 1 3
Super Petrol 4 1 2 3
4
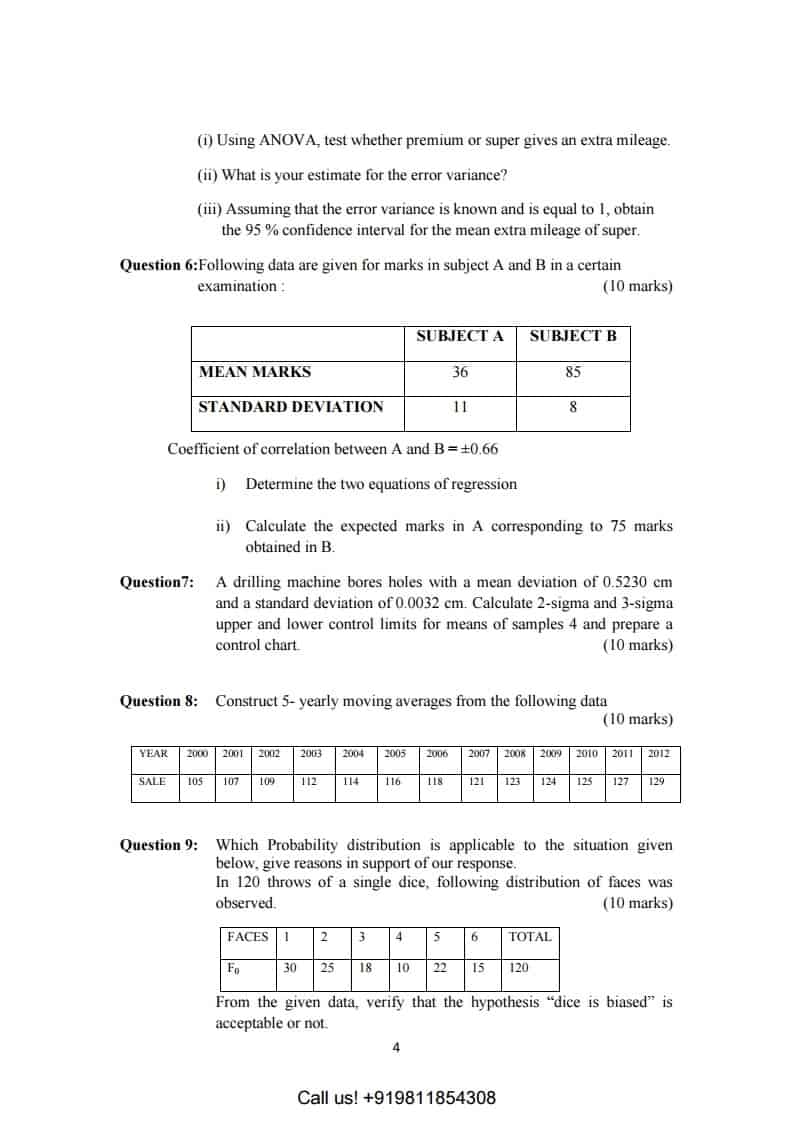
(i) Using ANOVA, test whether premium or super gives an extra mileage.
(ii) What is your estimate for the error variance?
(iii) Assuming that the error variance is known and is equal to 1, obtain
the 95 % confidence interval for the mean extra mileage of super.
Question 6:Following data are given for marks in subject A and B in a certain
examination : (10 marks)
Coefficient of correlation between A and B = ±0.66
i) Determine the two equations of regression
ii) Calculate the expected marks in A corresponding to 75 marks
obtained in B.
Question7: A drilling machine bores holes with a mean deviation of 0.5230 cm
and a standard deviation of 0.0032 cm. Calculate 2-sigma and 3-sigma
upper and lower control limits for means of samples 4 and prepare a
control chart. (10 marks)
Question 8: Construct 5- yearly moving averages from the following data
(10 marks)
YEAR 2000 2001 2002 2003 2004 2005 2006 2007 2008 2009 2010 2011 2012
SALE 105 107 109 112 114 116 118 121 123 124 125 127 129
Question 9: Which Probability distribution is applicable to the situation given
below, give reasons in support of our response.
In 120 throws of a single dice, following distribution of faces was
observed. (10 marks)
FACES 1 2 3 4 5 6 TOTAL
F0 30 25 18 10 22 15 120
From the given data, verify that the hypothesis “dice is biased” is
acceptable or not.
SUBJECT A SUBJECT B
MEAN MARKS 36 85
STANDARD DEVIATION 11 8
5
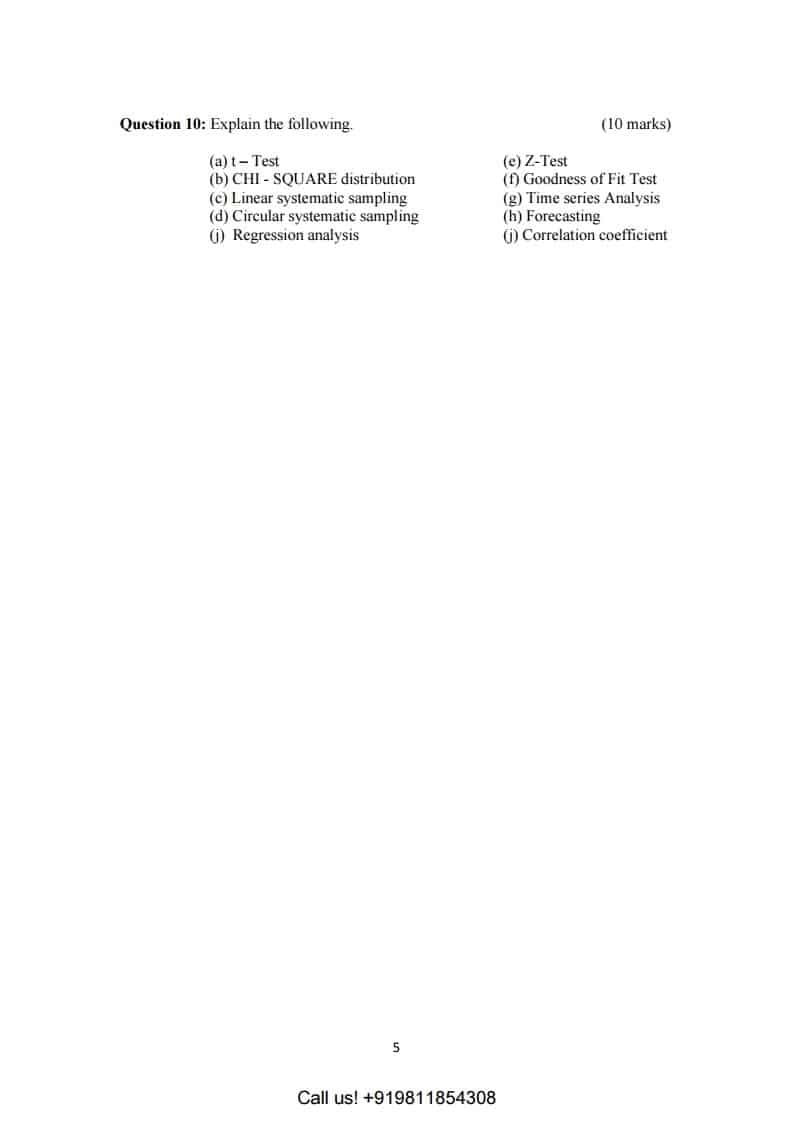
Question 10: Explain the following. (10 marks)
(a) t – Test (e) Z-Test
(b) CHI – SQUARE distribution (f) Goodness of Fit Test
(c) Linear systematic sampling (g) Time series Analysis
(d) Circular systematic sampling (h) Forecasting
(j) Regression analysis (j) Correlation coefficient


Reviews
There are no reviews yet.