- Your cart is empty
- Continue Shopping


-60%
.pdf_4")
.pdf_5")
.pdf_5")
BECS-184 DATA ANALYSIS in English Solved Assignment 2024-2025
₹40.00Current price is: ₹40.00. Original price was: ₹100.00.
BECS-184 DATA ANALYSIS
Solved Assignment 2024-2025
Tutor Marked Assignments
Course Code: BECS-184
Assignment Code: Asst /TMA /2024-25
Total Marks: 100
Add to cart
Buy Now
BECS-184 DATA ANALYSIS Solved Assignment 2024-2025
Tutor Marked Assignments
Course Code: BECS-184
Assignment Code: Asst /TMA /2024-25
Total Marks: 100
| Title Name | BECS-184 Solved Assignment 2024-2025 |
| University | IGNOU |
| Service Type | Solved Assignment (Soft copy/PDF) |
| Course | CBCS (BAG/BCOMG/BSCG) |
| Language | ENGLISH |
| Semester | 2024-2025 Course: CBCS (BAG/BCOMG/BSCG) |
| Session | For July 2024 and January 2025 Admission cycle |
| Short Name | BECS-184 |
| Assignment Code | Asst /TMA /2024-25 |
| Product | Assignment of CBCS (BAG/BCOMG/BSCG) 2024-2025 (IGNOU) |
| Submission Date | For students of July cycle: 30 April For students of January cycle: 31 Oct |
Assignment One
Answer the following questions. Each question carries 20 marks 2 × 20 = 40
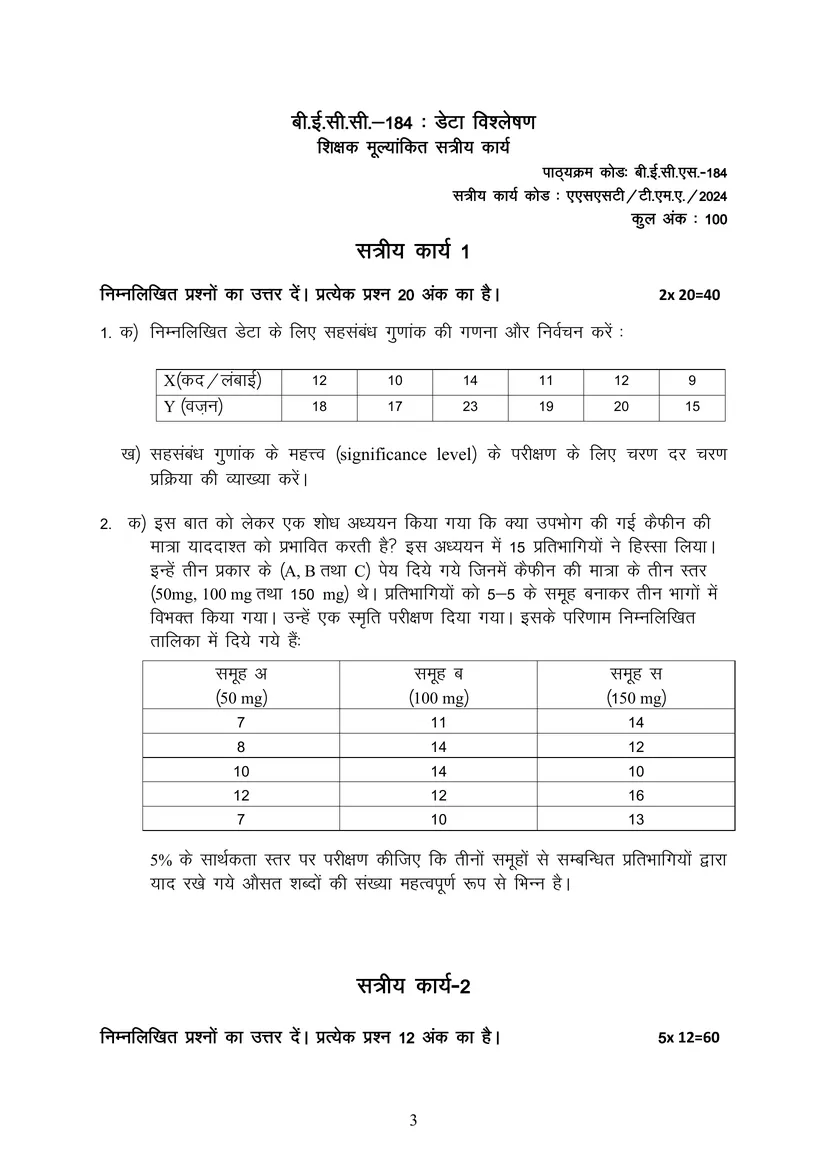
1. (a.) Compute and interpret the correlation coefficient for the following data:
X(Height) 12 10 14 11 12 9
Y (Weight) 18 17 23 19 20 15
(b) Explain step by step procedure for testing the significance of correlation coefficient.
2. (a.) What is meant by the term ‘mathematical modeling’? Explain with example the
various steps involved in mathematical modeling.
(b) What is logic? Why is it necessary to know the basics of logic in data analysis?
Assignment Two
Answer the following questions. Each question carries 12 marks.
5 X 12=60
3. Differentiate between Census and Survey data. What are the various stages involved in
planning and organizing the censuses and surveys?
4. Explain the following:
a. Z score
b. Snowball sampling techniques
c. Type I and type II errors
d. Normal distribution curve
5. a.) “Correlation does not necessarily imply causation” Elucidate.
b.) A study involves analysing variation in the retail prices of a commodity in three
principal cities-Mumbai, Kolkata and Delhi. Three shops were chosen at random in each
city and retail prices (in rupees) of the commodity were noted as given in the following
table:
Mumbai Kolkata Delhi
643 469 484
655 427 456
702 525 402
At significance level of 5%, check whether mean price of the commodity in the three
cities are significantly different. (Given F (critical) with 2 and 6 as numerator and
denominator degrees of freedom, respectively at 5% level of significance to be 5.14)
6. a.) What are the conditions when t test, F test or Z test are used?
b.) What is multivariate analysis? What are the important points to be kept in mind while
interpreting the results obtained from multivariate analysis.
7. Differentiate between:
a. Quantitative and Qualitative Research
b. Phenomenology and Ethnography
c. Observational and experimental method
d. Point estimate and interval estimate
BECS-184, BECS 184 BECS184
Related products

BECS-184 आँकड़ा विश्लेषण in Hindi Solved Assignment 2024-2025
₹40.00Current price is: ₹40.00. Original price was: ₹100.00.
BECS-184 आँकड़ा विश्लेषण (BAM) in Hindi Solved Assignment 2024
₹40.00Current price is: ₹40.00. Original price was: ₹100.00.
BECS-184 DATA ANALYSIS in English Solved Question Paper December 2023
₹25.00Current price is: ₹25.00. Original price was: ₹100.00.
Reviews
There are no reviews yet.